

About Me.
.NET Developer | Data Enthusiast | Power BI | Telerik Report Designer
I'm Prabesh Shrestha. I thrive at the intersection of clean code and clear insights. Whether it’s transforming raw data into compelling dashboards or building intuitive web applications, I’m passionate about turning ideas into impactful digital solutions.
What drives me? Curiosity, collaboration, and the constant pursuit of better. I enjoy working closely with teams and clients to craft solutions that don’t just work—but make a difference. From designing dynamic UIs to uncovering stories hidden in data, I’m always exploring new ways to bridge technology and real-world impact.
Always learning. Always building. Let’s connect and create something awesome! 🚀
EXPERIENCE
Grafi Offshore
Sanepa Height, Lalitpur
Jun 2024 – Jun 2025
.NET Developer
- Built and integrated ASP.NET Web APIs with authentication/authorization, using Repository and MVC patterns for maintainable architecture.
- Implemented Telerik Reporting (Designer, Server, Viewer) across environments created documentation and supported client integration.
- Developed responsive web pages using Kendo UI with ASP.NET, Web API, and Entity Framework for full-stack functionality.
- Contributed to Leslinq's core product team, collaborating on UI/UX with designers and iterating features with the product team.
- Managed report infrastructure and deployments, ensuring reliable performance and availability of reporting features across dev, staging, and production environments.
- Worked extensively with .NET technologies, developing scalable back-end services and implementing business logic using ASP.NET MVC, Web API, Entity Framework, and LINQ.
- Conducted product demos in end-of-sprint reviews to brief the senior management on the product features and updates.
Grafi Offshore
Sanepa Height, Lalitpur
Apr 2024 – Jun 2024
.NET Trainee
- Developed a dynamic, user-friendly Movie Rental App using ASP.NET MVC, C#, and SQL, focusing on responsive UI design and implementing efficient CRUD operations for various modules.
- Designed and integrated Web API controllers for seamless data retrieval and manipulation, enhancing overall application functionality.
- Integrated the ASP.NET project database with Power BI via authenticated APIs, managed database tasks (schema design, stored procedures), performed data analysis using SSMS, and delivered insightful dashboards and reports for clients.
- Collaborated directly with clients to gather requirements, ensured timely project delivery, and provided effective, tailored solutions to meet their expectations.
LIS Nepal
Kumaripati, Lalitpur
Oct 2023 – Apr 2024
Software Intern
- Worked on data warehousing, ETL pipelines, data modeling, and performance optimization using SSMS, SSIS, SSRS, and Snowflake.
- Created interactive dashboards and visualizations in Power BI and MS Excel to support data-driven decision-making.
- Collaborated with clients and internal teams to gather requirements, resolve incidents via JIRA, and ensure timely updates through effective communication.
- Conducted end-to-end data cleansing, transformation, and integration from diverse data sources to maintain consistency and improve data quality.
Skills
Languages
Frontend
Database & ETL
Reporting & BI
Backend & APIs
Tools & Platforms
Projects
Here are some of the projects I've worked on.
Text to Image Synthesis using GAN
Implemented a Generative Adversarial Network for converting textual descriptions into realistic images.
PARIKSHYA – WebApp for Online Examination
Developed a secure online examination platform with video conferencing and real-time monitoring capabilities.
Movie Rental System (ASP.NET MVC)
Developed a rental app with CRUD functionality, billing, PDF receipts, and API integration.
E-commerce Website
Developed a Python-Django-based e-commerce site with filtering, search, and customer engagement features.
Uber Data Analytics
Built ETL pipeline with Pandas. Visualized KPIs in Power BI.
BookStore Management System
Developed a modular BookStore Management System using ASP.NET Core MVC with Entity Framework, secure authentication, role-based access control, and SQL Server integration.
...and that's all for now. More projects coming soon! ✨
Dashboards
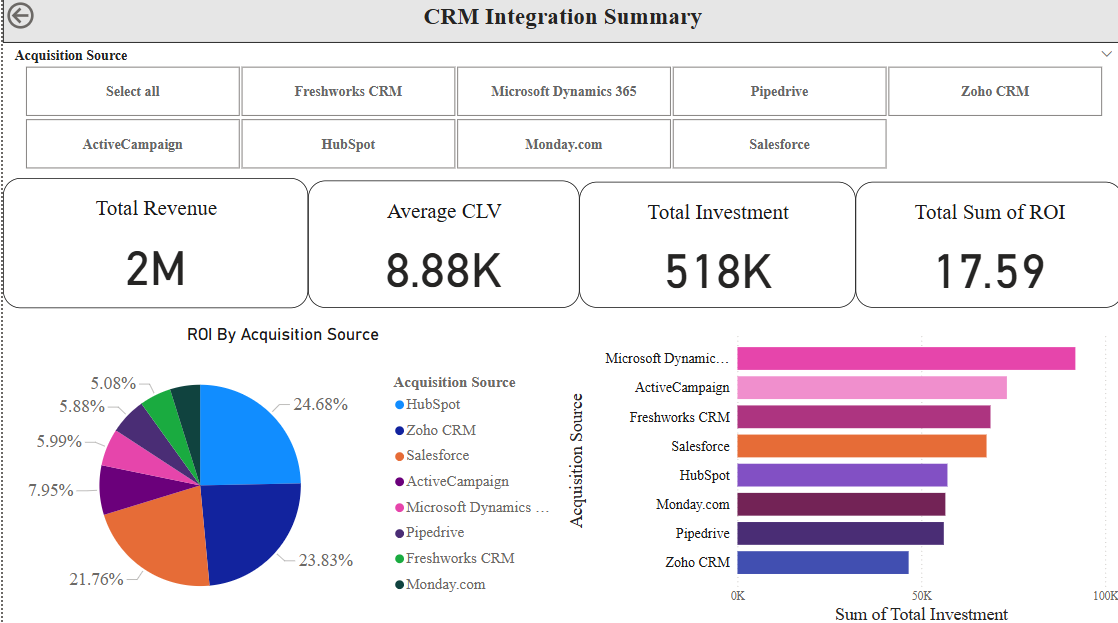 CRM Integration Summary:
Power BI dashboard analyzing CRM platforms by acquisition source, total revenue, customer lifetime value (CLV), total investment, and ROI distribution across tools like HubSpot, Salesforce, and Zoho CRM.
CRM Integration Summary
(Power BI)
CRM-based ROI and investment analysis across acquisition channels.
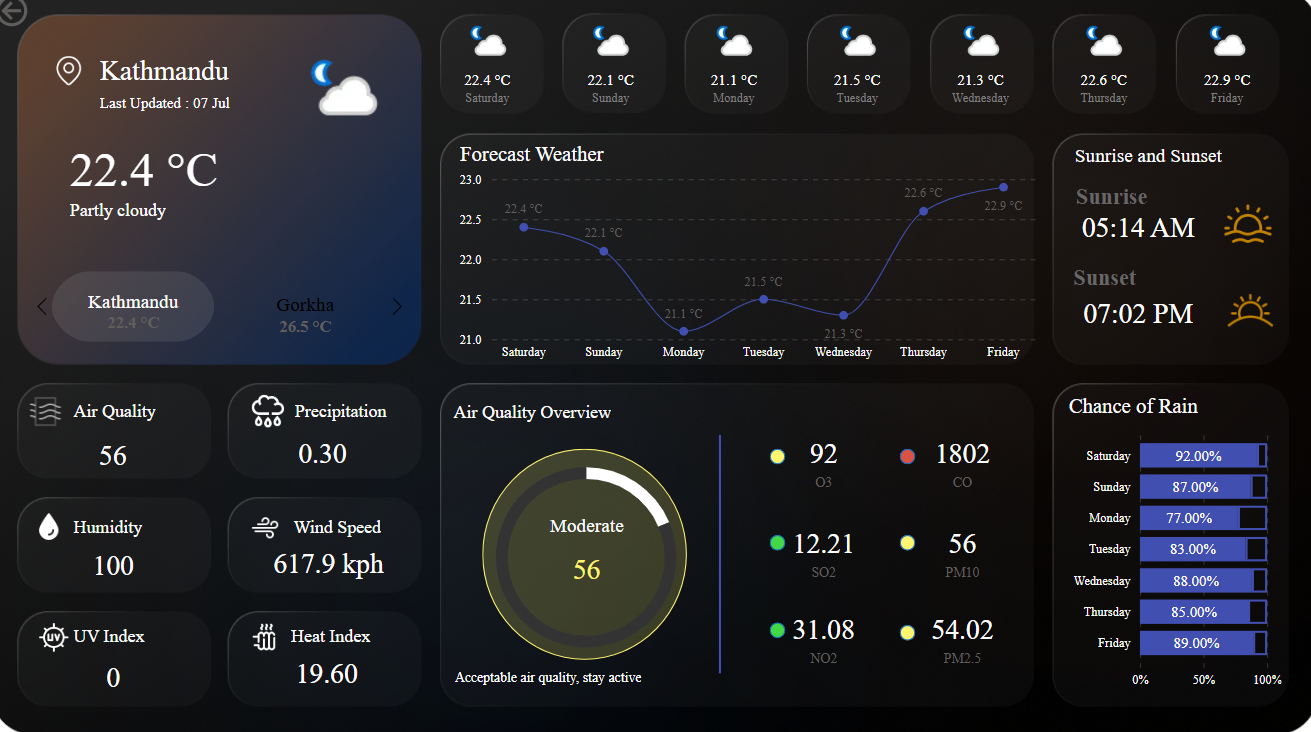 Weather Forecast Dashboard – Kathmandu:
 Interactive Power BI dashboard for weather monitoring in Kathmandu, featuring live temperature, air quality index, humidity, wind speed, UV index, and a 7-day forecast with sunrise/sunset times and rain probability.
Weather Forecast Dashboard
Kathmandu (Power BI)
Live weather insights and 7-day forecast for Kathmandu
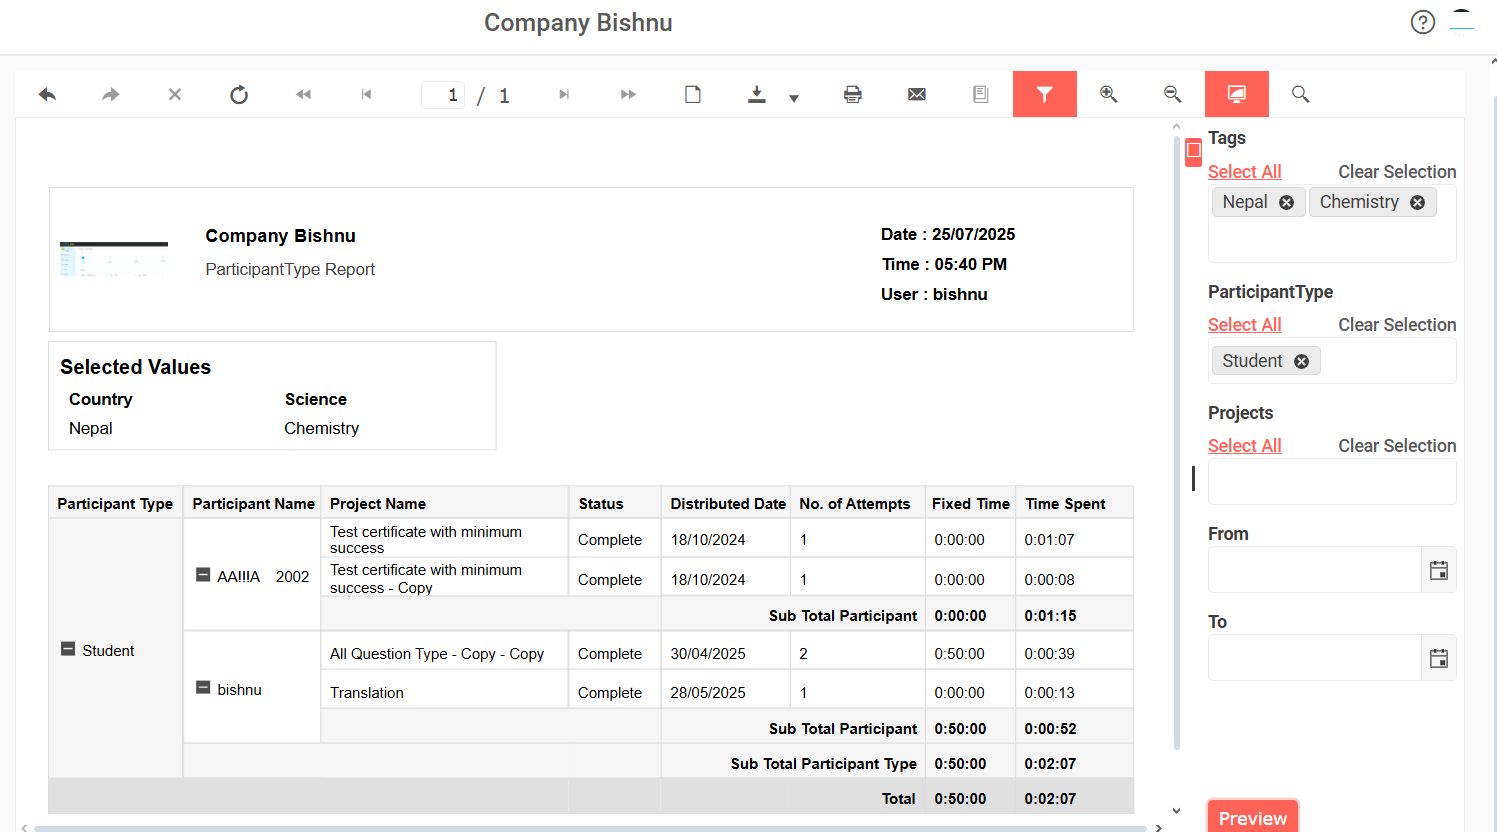 Participant Type Report (Telerik Report Designer):
 This dynamic Participant Type Report presents comprehensive analytics based on participant engagement in company-distributed projects. The report header displays essential company metadata like report date, user info, and selected filters (e.g., company, date range, participant type).
In the detailed section, the report lists each participant's project attempts categorized by participant type, including metrics such as attempt counts, completion status, distribution dates, and time spent.
Developed using Telerik Reporting, this report is viewed through the Telerik HTML5 Report Viewer and hosted on the Telerik Report Server, enabling features like:
📩 Emailing reports
📥 Exporting to formats: PDF, Word, Excel, XML
🖨️ Direct printing support and many more.
Participant Type Telerik Report
(Telerik Report Designer)
Telerik report for tracking participant engagement in company projects.
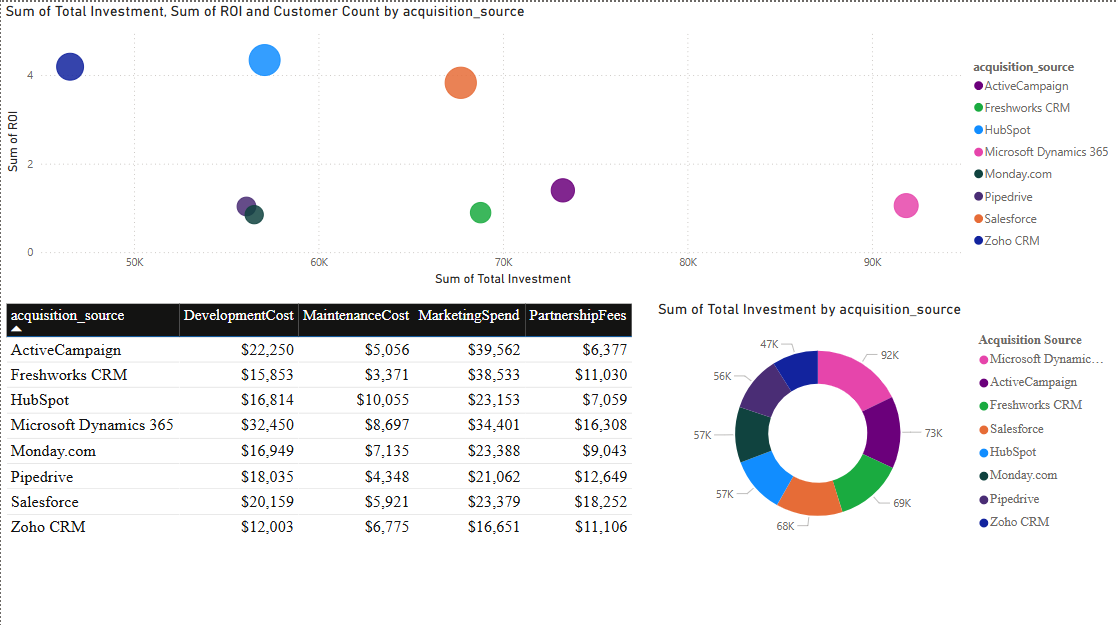 CRM Investment vs ROI View (Power BI):
Expanded view of the CRM Integration Summary dashboard highlighting the relationship between total investment and ROI across acquisition sources. Visuals include a bubble chart and cost breakdown per platform, offering deeper insight into the efficiency of CRM investments.
CRM Investment vs ROI View
(Power BI)
Extended analysis from the CRM Integration Summary dashboard focusing
on total investment vs ROI across CRM acquisition sources.
 Weather Forecast Dashboard – Gorkha:
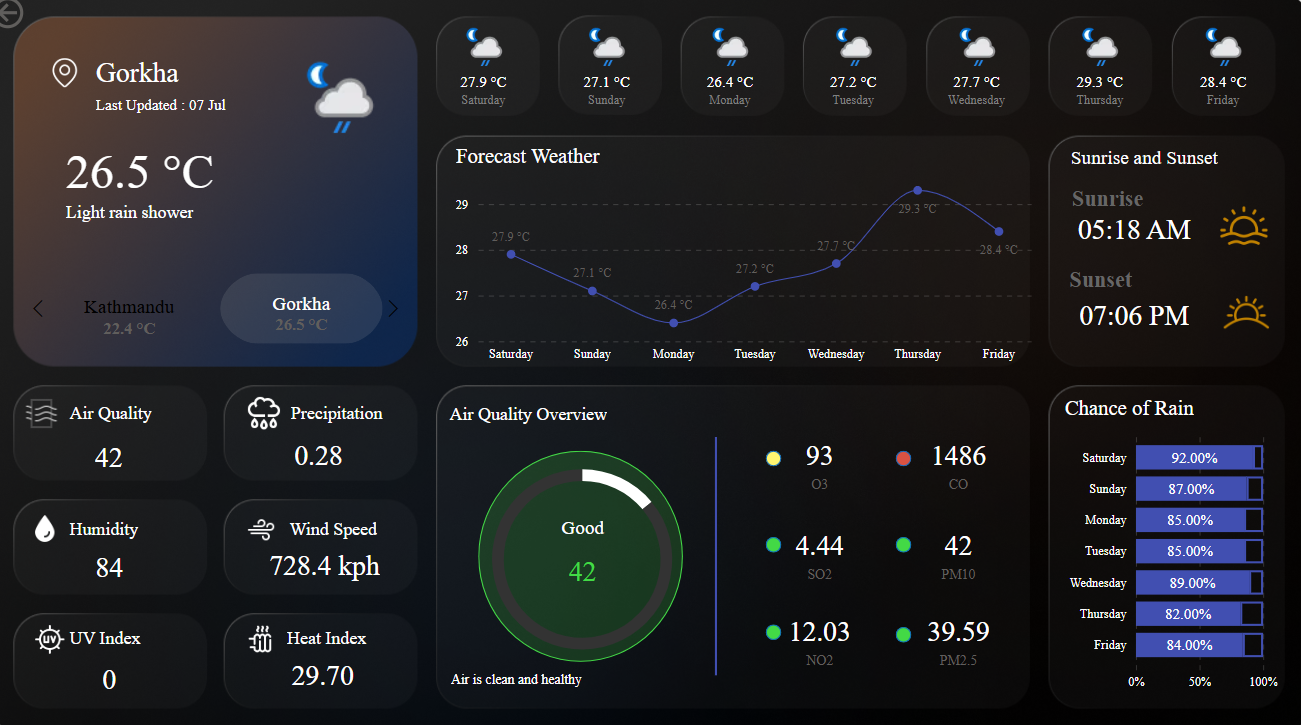
 Interactive Power BI dashboard for weather monitoring in Gorkha, featuring live temperature, air quality index, humidity, wind speed, UV index, and a 7-day forecast with sunrise/sunset times and rain probability.
Weather Forecast Dashboard
Gorkha (Power BI)
Live weather insights and 7-day forecast for Gorkha
 Project Report (Telerik Report Designer):
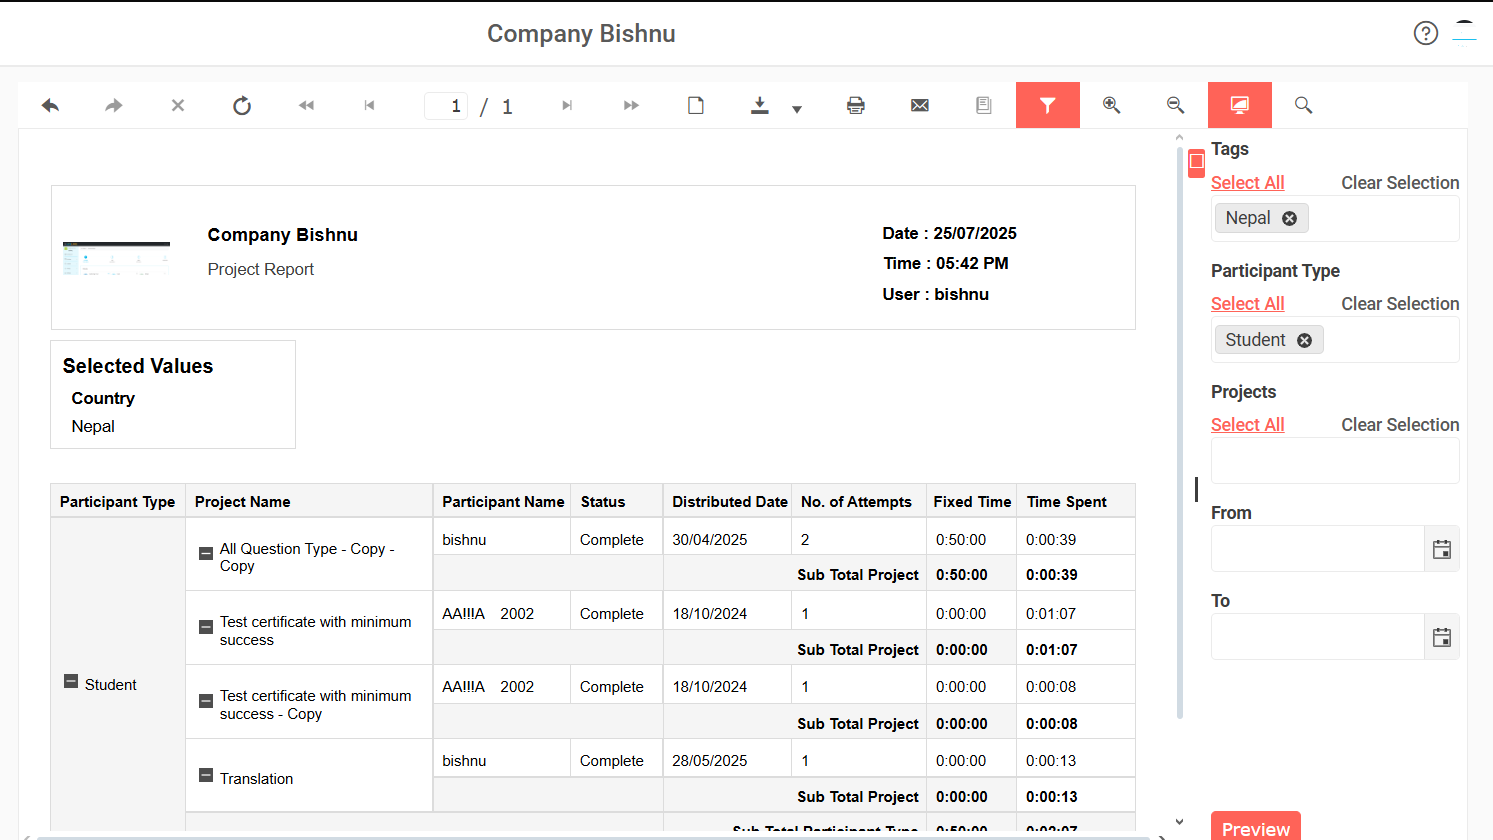
 This dynamic Project Report presents comprehensive analytics based on participant engagement in company-distributed projects. The report header displays essential company metadata like report date, user info, and also there is selected filters (e.g., company, date range, project).
In the detailed section, the report lists each project's' attempts by participant, including metrics such as attempt counts, completion status, distribution dates, and time spent.
Developed using Telerik Reporting, this report is viewed through the Telerik HTML5 Report Viewer and hosted on the Telerik Report Server, enabling features like:
📩 Emailing reports
📥 Exporting to formats: PDF, Word, Excel, XML
🖨️ Direct printing support and many more.
Project Telerik Report
(Telerik Report Designer)
Telerik report for tracking participant engagement based on projects
 Company Report (Telerik Report Designer):
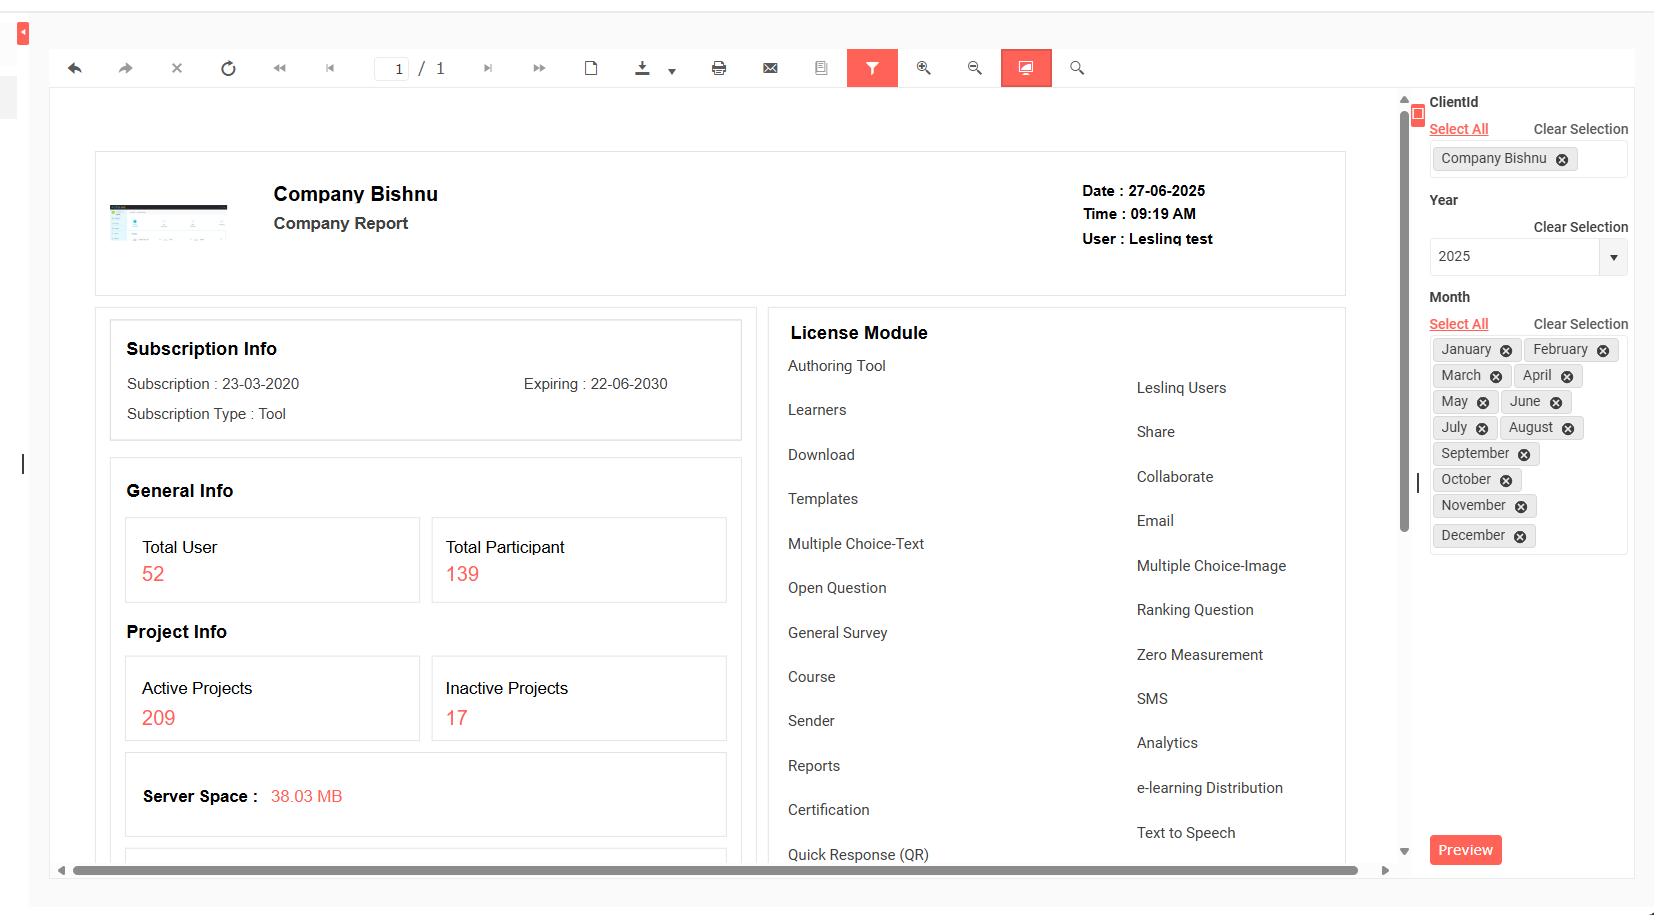
 Admin-focused Company Report provides a summarized view of a company’s platform usage for a selected year and months. It includes:
- Company Details: Selected client, year, months, report date/time, and user info.
- Subscription Info: Start and end date, and subscription type.
- User & Project Stats:Total users, participants, active/inactive projects, and server space used.
- Licensed Modules: Lists all features/modules assigned to the company (e.g., surveys, email, analytics).
- Utilization Summary Table: Monthly breakdown of:
- Embedded/Public/Private link clicks
- Public/Private QR clicks
- Total certificates sent
- Total Downloads
- Emails & SMS sent (individually and combined)
Company Telerik Report
(Telerik Report Designer)
Overview report showing company usage stats, licensed modules,
and engagement metrics based on selected filters like company, year, and months.
 Usage Overview Report (Telerik Report Designer):
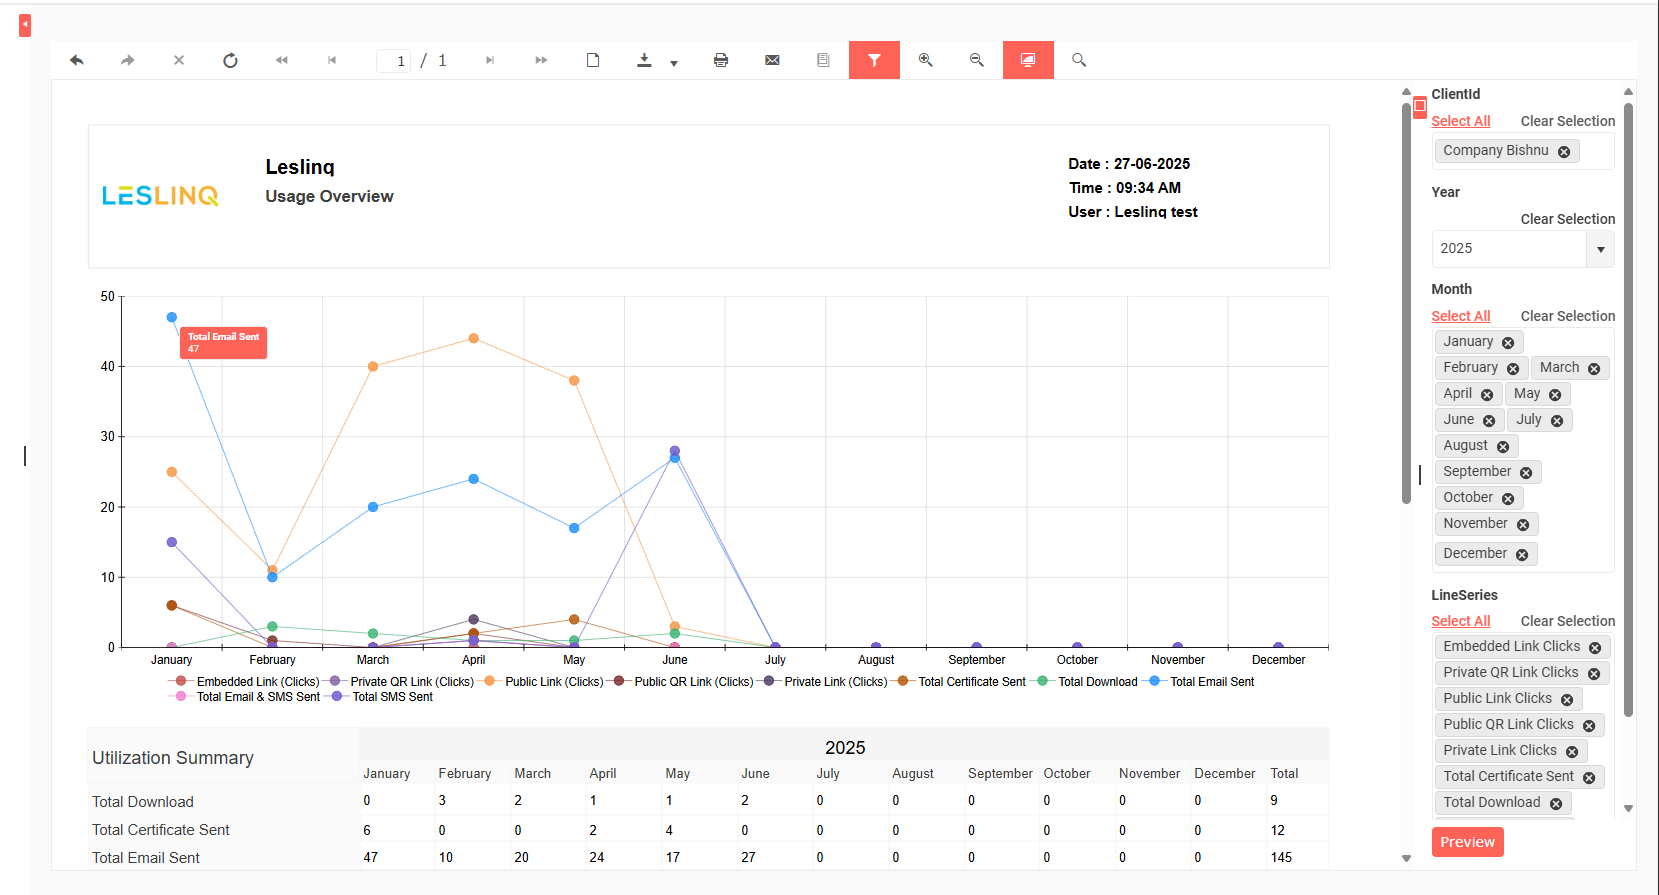
 Admin-focused Usage report showing monthly engagement trends across companies using a line chart and utilization table.
- Tracks clicks, downloads, certificates, email & SMS activity.
- Data updates based on selected filters: company, year, months, and LineSeries (to show/hide specific lines).
- Supports single or multi-company selection:
- One company → individual stats
- Multiple companies → combined totals
- All companies → full system totals
- Data updates based on selected filters: company, year, months, and metrics.
- Hovering on chart markers shows a tooltip with the count for that data point.
Usage Overview Report
(Telerik Report Designer)
Admin report showing monthly engagement trends with filters for company,
year, months, and line chart. Supports single or combined company data.
Education
Bachelor in Computer Engineering
Kathmandu Engineering College • Kathmandu, Nepal
Graduated: 05/2023
Higher Secondary Education – Science (Grade 11 & 12)
United Academy • Lalitpur, Nepal
Completed: 11/2018
Secondary Education (Grade 10)
Deepshikha Higher Secondary Boarding School • Dang, Nepal
Completed: 04/2016
Contact
Let's Connect
Nepal
Visit my social profile and get connected